A dearth of insulation around neuronal projections may explain why some parts of the cerebral cortex can appear thicker in brain scans of autistic people than in those of non-autistic people, according to a new study.
Magnetic resonance imaging (MRI) studies show that some autistic children have bigger brains than their non-autistic peers, with much of the overgrowth occurring in the cerebral cortex. The reason for this difference remains unclear, but it seems to reflect an apparent excess of gray matter, which consists of neuronal cell bodies, relative to white matter, composed of neuronal projections.
Newly developed neurons in the brains of autistic people may have trouble migrating to the proper place, some researchers have suggested, which could blur the boundary between gray and white matter in some regions and cause the gray matter to look thicker on an MRI scan.
But higher levels of myelin, the insulation that surrounds neuronal projections, in non-autistic people could also skew these measures, says lead researcher of the new work, Mallar Chakravarty, associate professor of psychiatry at McGill University in Montreal. Myelin appears brighter on an MRI scan than other tissue, so an abundance of it near the boundary between gray and white matter could make the gray matter appear thinner, he says.
To distinguish between the two hypotheses, Chakravarty and his colleagues devised a new way to evaluate the sharpness of the boundary between white and gray matter on MRI scans.
Differences in boundary sharpness cropped up in regions with atypical cortical thickness in autistic people, they found. And the boundary between gray and white matter was sharper in certain brain regions for autistic people than in those of non-autistic people, suggesting that atypical myelination drove those differences in thickness.
“[It’s] a very smart approach to help us learn more about the significance of some of the neuroimaging measures that we are studying,” says Antonio Hardan, professor of psychiatry and behavioral sciences at Stanford University in California, who was not involved in the work.
Sharp edge:
Chakravarty and his colleagues applied their new method to scans from 415 autistic people and 721 non-autistic people, aged 2 to 65 years, from multiple international datasets, including the United Kingdom Medical Research Council Autism Imaging Multicentre Study and the Autism Brain Imaging Data Exchange. The team had previously analyzed cortical thickness on these same scans.
For each brain scan, they sampled 77,212 points across the cortex, measuring image intensity at 10 equidistant spots across the boundary between gray and white matter.
They used these values to calculate the rate of change in intensity, a metric they call the ‘boundary sharpness coefficient’: High values mean the intensity changes rapidly, marking a sharp boundary, whereas low values reflect gradual change, characteristic of a blurry boundary.
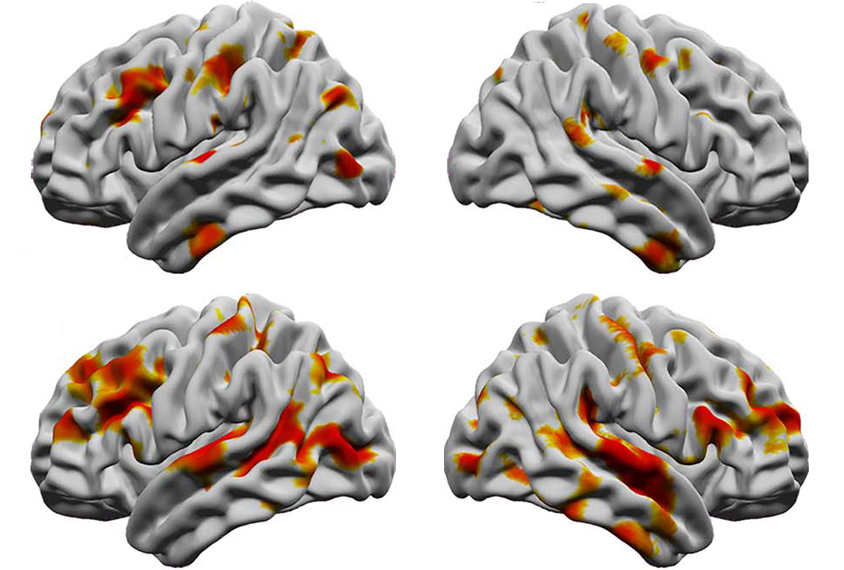
Autistic people show sharper boundaries than non-autistic people in specific brain areas, including the bilateral superior temporal gyrus, the inferior temporal gyrus and the left inferior frontal gyrus, the researchers reported in March in Cerebral Cortex.
Boundary sharpness differed the most between autistic and non-autistic people aged 12 to 20 years, the team found. And boundary sharpness measurements of autistic participants’ right medial temporal pole correlated with the severity of their autism traits, as measured by the Autism Diagnostic Observation Schedule.
New measures:
Because intracortical myelination reflects the strength of connections between brain regions, the results bolster the argument that autism is a condition of atypical connectivity, says study investigator Emily Olafson, a graduate student in Amy Kuceyeski’s lab at Cornell University.
But because the finding of a sharper gray-white boundary in the brains of people with autism is the opposite of what has been seen in previous studies, it is difficult to interpret, says Ruth Carper, associate research professor of psychology at San Diego State University, who was not involved in the study.
“It might be true. It might be wrong,” she says. “It’s worth more follow-up.”
One way to follow up would be to use animal models or postmortem samples to see if the boundary sharpness measure reflects what is actually in the tissue, Hardan says.
And replication of the results by other groups, using other datasets, is also essential, all of the researchers agreed.
Regardless of how the specific results hold up, however, the new metric has the potential to improve how cortical boundaries are measured using MRI, Carper says.
