Listen to this story:
0:00
/
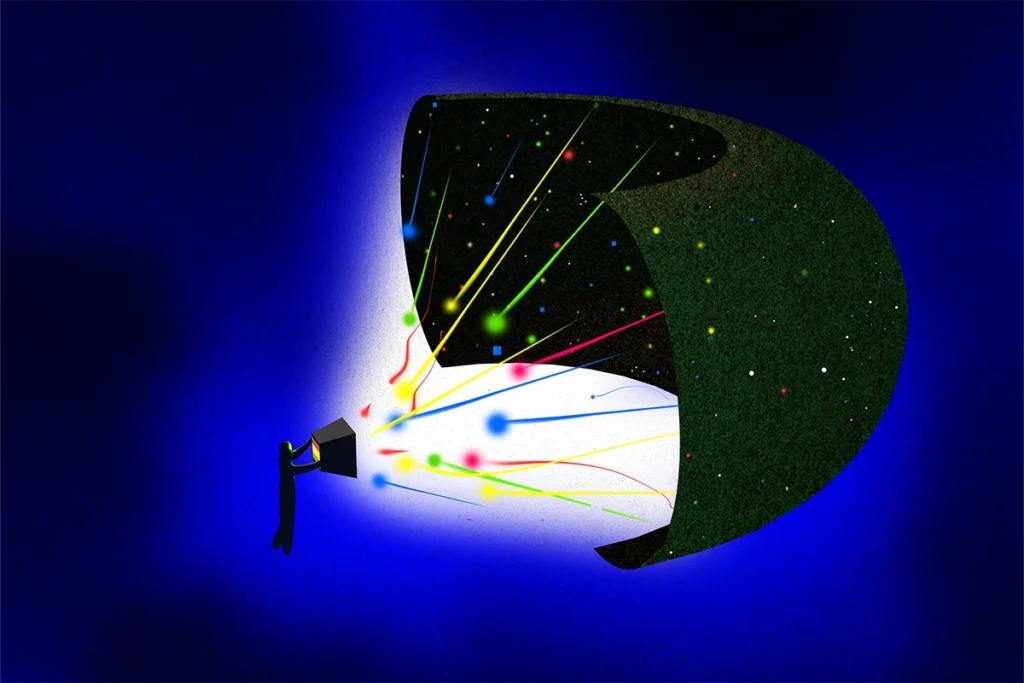
Evolutionarily newer regions sport mitochondria with a higher capacity for energy production than older regions, according to the first detailed map of the organelles in a tissue slice, adding to mounting evidence that the brain features a metabolic gradient.

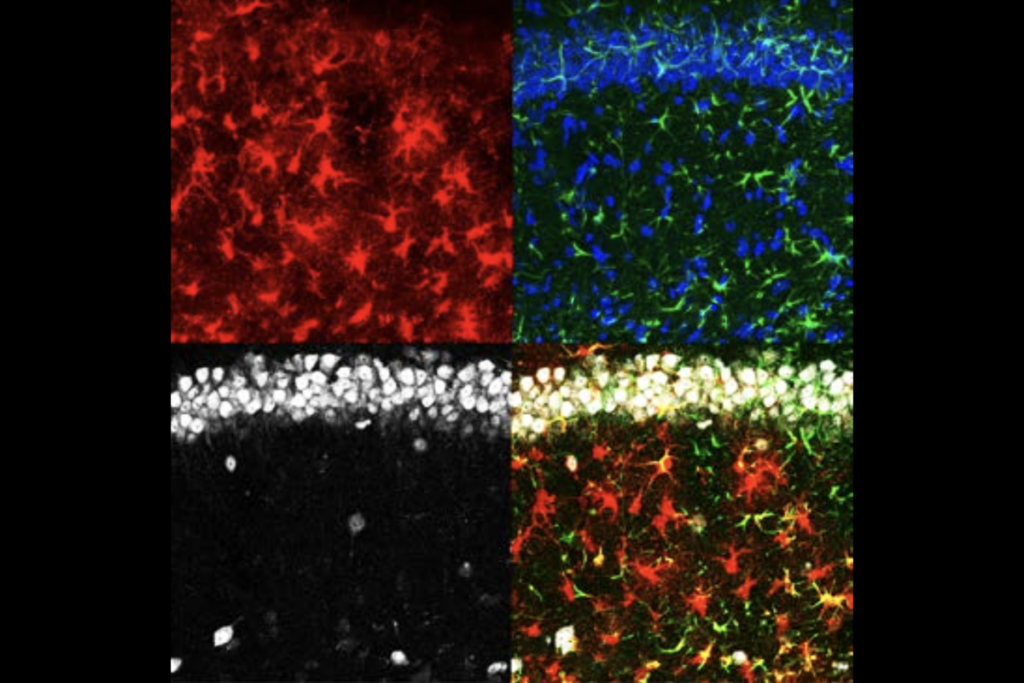
The number of mitochondria and their function vary across brain regions and cell types, according to the MitoBrainMap, the first detailed atlas of the cell’s energy factories.
The map, derived from a biochemical and molecular analysis of mitochondria in adult human brain tissue, reveals a heterogenous “bioenergetic landscape” that was hidden in previous neuroimaging studies, says Martin Picard, associate professor of behavioral medicine at Columbia University, who led the new work.
Until now, neuroscientists tapped PET and MRI to try to understand mitochondria biology throughout the brain. But these imaging approaches lack granular resolution, and the features they capture, such as blood flow, are typically only proxies for energy production.
“We don’t know much yet about the energetics of the brain from imaging,” says Valentin Riedl, a researcher at Friedrich-Alexander University and at Technical University Munich, who was not involved in the new map.
Gray matter has more than 50 percent more mitochondria than white matter, and different brain regions show varying levels of respiratory capacity, according to the new findings, published last month in Nature. The mitochondrial variability and local specialization also suggest regionally distinct energetic strategies, Riedl says. In particular, brain regions that arose later in evolution, such as cortical areas, have mitochondria that display a particularly high capacity for ATP production, which cells use for fuel. The results jibe with neuroimaging evidence of a metabolic gradient in the brain, published in 2023.
“The more recent human brain regions had a higher energy turnover than the older, evolutionarily established brain areas,” says Riedl, who led the 2023 work. Before, “we could only do that on the macroscale,” he says. The new study controlled for regional variations in the number and density of neurons, giving a more accurate picture of the energy-producing capacity of the mitochondria. The results are “perfectly matching,” he says.
T
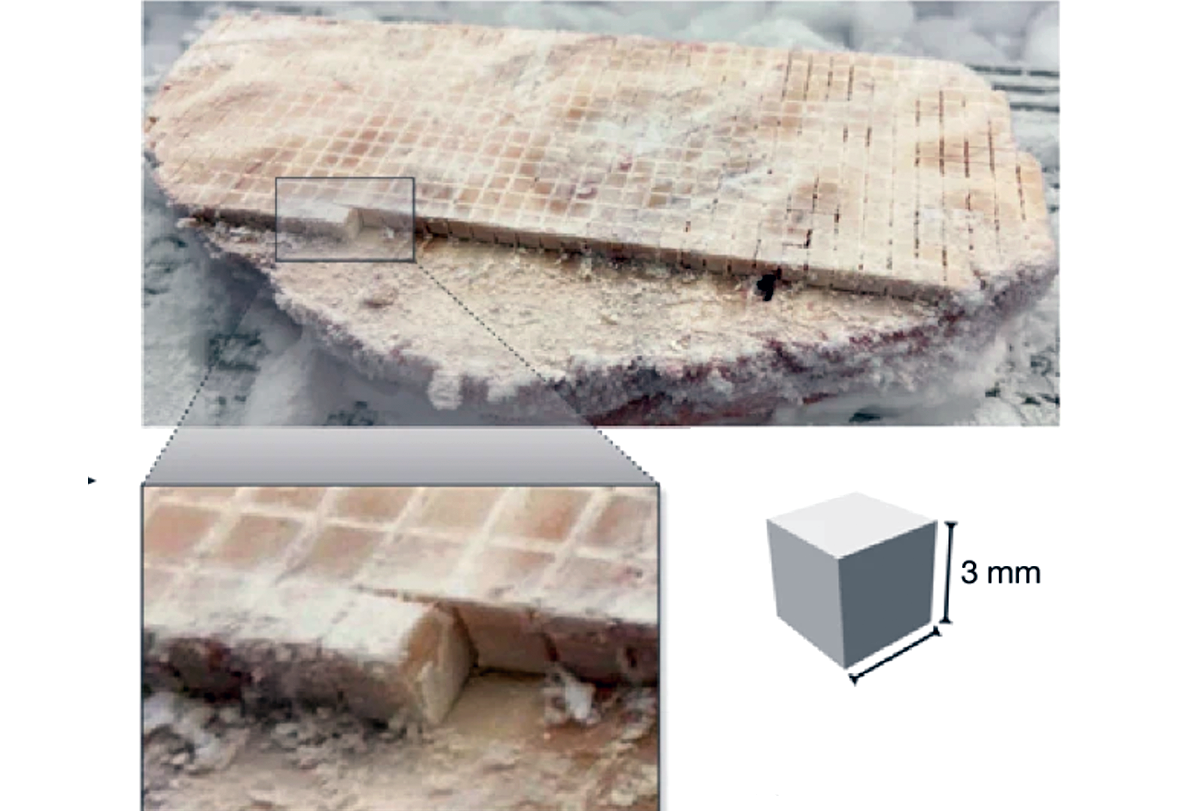
o create the map, Picard and his team needed to partition brain tissue into small cubes, or “voxels.” After a few failed trials, which included trying to slice through room-temperature tissue using diamond wire, they realized the tissue needed to be frozen first. So the team bought a laser engraver and set it up in a walk-in freezer. They managed to cut up a brain slice, containing both cortical and subcortical areas, into 703 3-millimeter cubes.The team then characterized each voxel’s mitochondrial density, mitochondrial enzyme activity, respiratory capacity and gene expression levels via single-cell RNA sequencing. “They neatly covered everything from structure to function,” Riedl says.
Even though the white matter had many fewer mitochondria than the gray matter, Picard says he was still surprised by the amount it had, because white matter is not that energetically demanding. Within the gray matter, phylogenetically older brain regions, such as the brainstem, had lower respiratory capacity than newer ones, such as cortical areas. This picture aligns with the idea that newer brain regions may have evolved to sustain the increased energy costs needed for the development of higher-order cognitive functions in humans, Picard says.
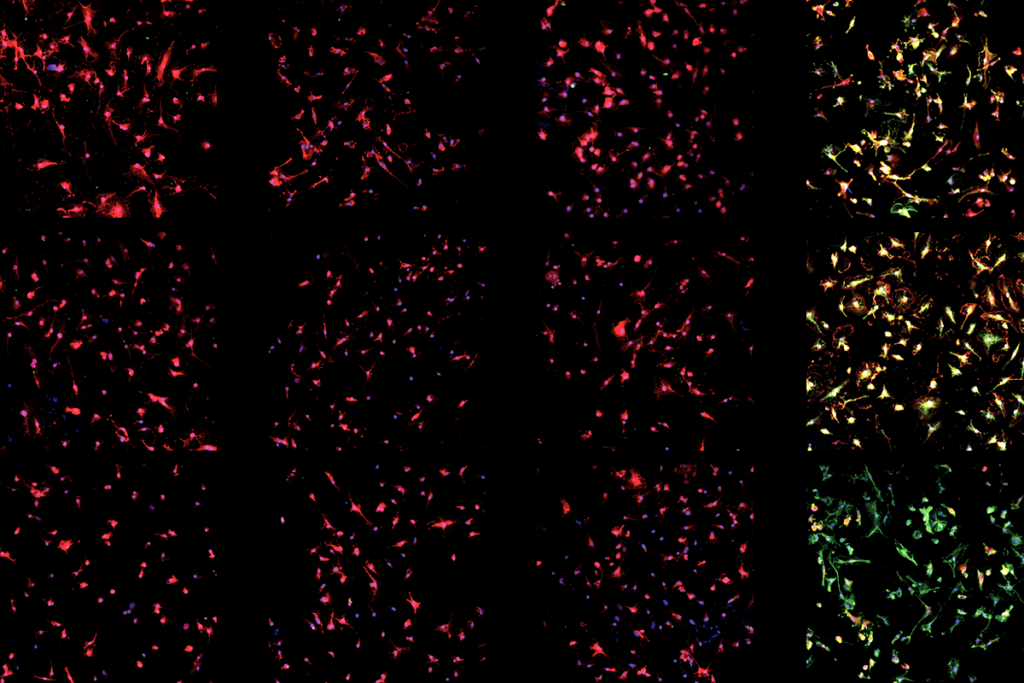
Even across cell types, not all mitochondria look the same. For example, endothelial cells in the brain showed the highest expression of energy-transforming enzymes compared with other cell types. This result suggests that mitochondria in the endothelial cells might be more active, but “that is more a puzzle than an answer” because it could also indicate they generate high levels of reactive oxygen species, says Fahmeed Hyder, professor of radiology and biomedical imaging and of biomedical engineering at Yale University, who was not involved in the study.
Some mitochondria might even be specialized for specific functions, such as burning fat. One of the dogmas in the field is that the brain burns only glucose, not lipids, Picard points out. “That’s true for neurons, but it’s definitely not true for other cell types,” he says. “There’s so many neurons that if you look at it as a whole, the brain doesn’t seem like it’s burning lipids, but there are some cell types that are actually capable of doing that.”
To try to bridge the gap between the molecular and imaging worlds, Picard’s team created a computational model to predict mitochondrial profiles from neuroimaging data. They first aligned 539 voxels from the postmortem brain slice (the subset with complete mitochondrial data) onto averaged brain scan data from an MRI dataset. They then used 80 percent of the voxels to train the model to match the mitochondrial features to the MRI metrics and found that it accurately predicted those features in the remaining 20 percent of voxels. In another test, the model accurately predicted mitochondrial features the team had measured in a second brain slice from the same brain donor.
Other researchers can use the freely available atlas to ask interesting questions, Riedl says. “We have the option to look in our brain [imaging] space now, into which areas are more or less efficient or more or less active, and you can start comparing that to patterns that are particularly important.”
T
he study is a great technological feat, but it is based on postmortem tissue, which uses energy differently depending on how it is processed, Hyder says: Once you take the mitochondria out of the brain, their structure begins to deform. And the findings need to be validated with direct measures of metabolism because the features the team measured, such as mitochondrial enzymes, are indirect and can only predict energy production, he adds.Further validation and studies can then also reveal which imaging parameters are related to which aspects of mitochondrial signaling activity, Riedl says.
But this is just the first version of the map, based on one 3-millimeter-thick section of an individual human brain, limiting the generalizability of the findings, Picard says. The team is working on its next iteration, which aims to average measures from 500 brains from both female and male donors across different ages. “Mapping the mitochondrial infrastructure is the first step towards understanding the brain as an energetic system and understanding how that manifests into important problems in neuroscience,” Picard says.