Elizabeth Hillman knows how to generate a mountain of data.
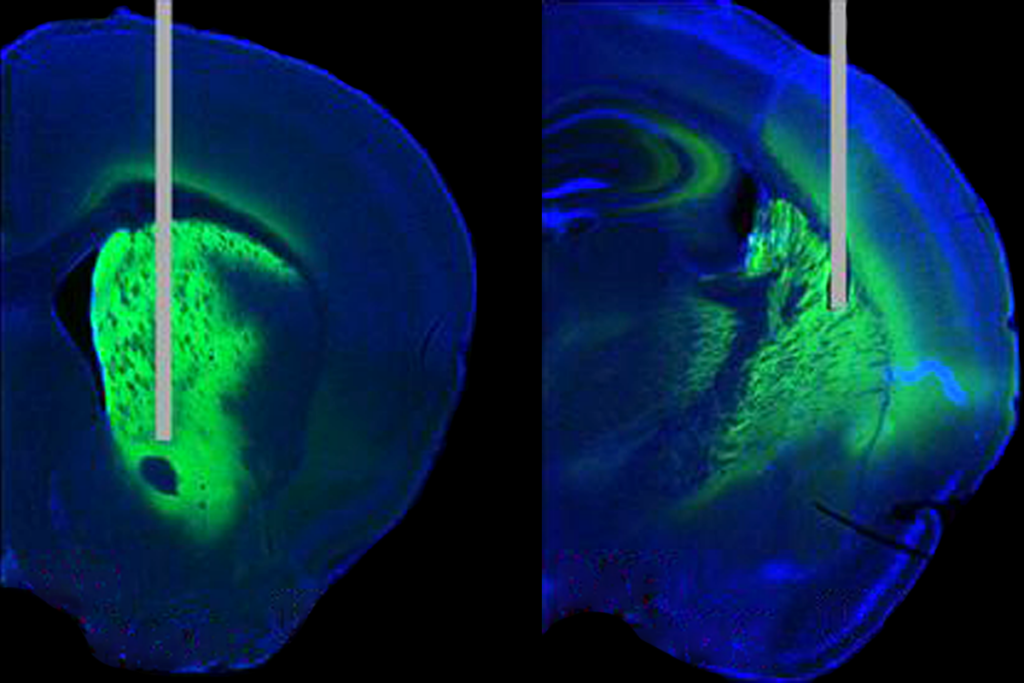
She has spent her career developing imaging techniques, such as wide-field optical mapping and swept confocally aligned planar excitation (SCAPE) microscopy, that enable her to measure neural activity across the whole brain in behaving animals, in real time. But it’s difficult to sort through the rich data such techniques produce and find interesting patterns, says Hillman, professor of biomedical engineering and radiology at Columbia University.
So, one day, inspired by a science-fiction book she read as a child, Hillman turned her data into music.
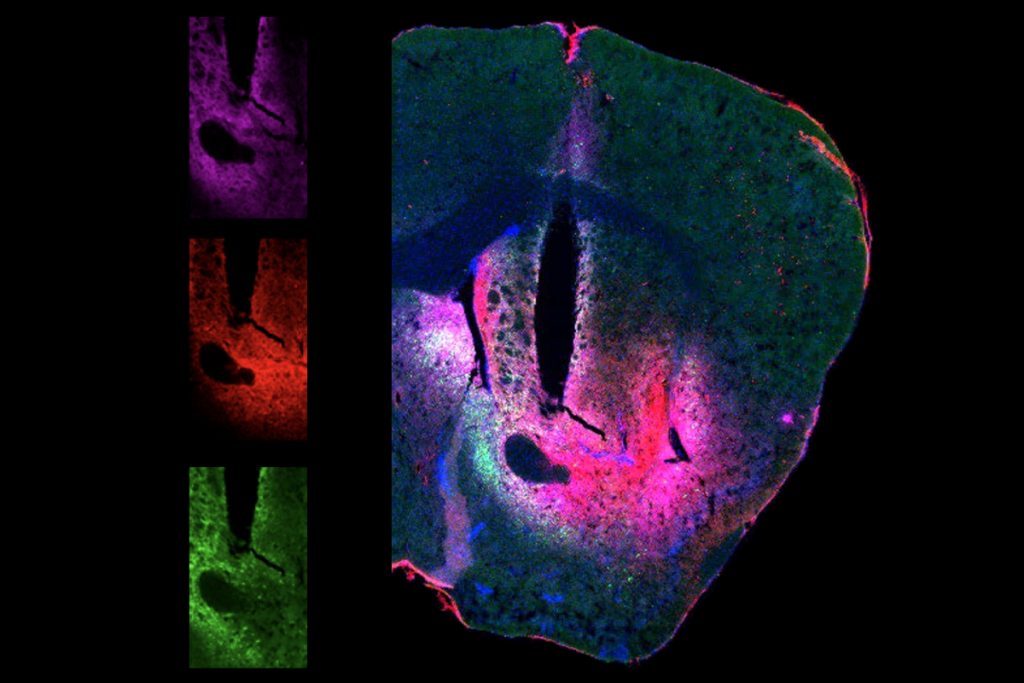
She wrote a program that translates aspects of imaging data into colors and musical notes of varying pitch. For example, activity in the caudal part of the brain is represented by dark blue and a low musical note. The resulting “audiovisualization” takes advantage of humans’ sensory processing abilities and makes it easier to spot patterns in activity across datasets, Hillman says.
“This is creative and novel work,” says Timothy Murphy, professor of psychiatry at the University of British Columbia. “There are potential uses of this in selectively visualizing many simultaneously active brain networks.”
Hillman and her team describe the method in a paper published today in PLOS ONE. They borrowed data from some of their prior studies to demonstrate three ways to use the program: One highlights spatial information, another focuses on the timing of neuronal firing, and the third demonstrates the overlap between behavioral, neuronal and hemodynamic data.
The Transmitter spoke with Hillman about how this technique came to be and how she envisions other scientists using it.
This interview has been edited for length and clarity.
The Transmitter: What motivated you to develop this technique?
Elizabeth Hillman: I trained in physics; my work focuses on developing brain imaging and microscopy methods. I have a long-standing interest in neurovascular coupling, so I started to develop technologies that could capture images of both neural activity and hemodynamics at the same time. I was particularly interested in increasing the speed and the signal-to-noise ratio of those imaging systems so that we can capture stuff in real time.
What led to this paper was an experiment where we were imaging activity across the surface of the brain in awake, behaving mice. We noticed these amazing, dynamic patterns in the brain when the animal was just sitting there, and then the oscillations changed when it started to run. The normal protocol for imaging studies is repeat, repeat, repeat; average, average, average. You need to average 50 times to get a signal.
But if we were to average all of those trials together, we’d get nothing. We had hours of these recordings and were trying to grasp how the brain activity we saw related to what the animal was doing. How could we start to piece this together and make sense of it? That’s when I decided to try playing it as music.
TT: How did you get that idea?
EH: I’d had this idea in the back of my head for years, ever since I read “Dirk Gently’s Holistic Detective Agency,” a novel by Douglas Adams, when I was about 15 years old. In one part of the book, a software programmer describes a program that converts a company’s financial data into music.
I quickly wrote a little script and started playing the sounds along with the videos. And then one of my students, David (Nic) Thibodeaux, got really inspired. He’s also a musician. He figured out all these other things that you could do with it and implemented it as a tool. We started applying it to data we were collecting for other studies. And then we got really hooked on it.
