Our brain activity is a constantly evolving mix of waves at different frequencies, depending on what we’re up to. We ramp up our alpha waves with meditation, increase the gamma gain for difficult cognitive work and settle into slow delta waves while we’re sleeping. Researchers have been able to observe brain oscillations for more than 100 years, but what do these actually do?
Many brain wave theories have cycled in popularity over the past century. Some researchers claim that brain waves are central to synchronizing the activity of single neurons or helping the brain process information. Others purport that they are simply the neural exhaust of a bioelectric organ.
About a decade ago, Kei Igarashi, Laura Colgin and Nobel-Prize-winning scientists May-Britt and Edvard Moser set out to understand whether brain waves had anything to do with helping us consolidate memories. Building on other research suggesting that very fast gamma oscillations and slower theta oscillations might interact to form memories, they looked for cold, hard evidence that this was indeed the case. In doing so, they established an important foundation in memory research: the premise that brain regions oscillate together to form synaptic connections and, ultimately, memories.
PAPER OVERVIEW
Declarative memory allows us to consciously recall facts we have learned—that the Panama Canal was completed in 1914, for example—or specific episodes in our lives—that you visited Panama when you were 13 years old. It’s also one of many different functions that research has tied to brain oscillations.
When we first form and when we retrieve these kinds of memories, parts of our cortex and hippocampus vibe at two particular frequencies: a low, cool theta rhythm alongside a quicker gamma oscillation. Multiple studies across rats and humans have shown that when theta and gamma frequencies ebb and flow together within the hippocampus, we remember more. Earlier work in the Moser Lab also showed that fast gamma alone could synchronize different brain regions but did not directly tie this observation to learning and memory.
Until the 2014 paper, memory researchers had not observed changes in synchronization between brain regions during behavior and did not know how oscillations related to changes in single neurons. Igarashi et al. sought to understand what precisely was happening in the brain when brain waves synchronize, and how it might enable animals to remember.
This paper tackles the mechanisms of memory, making it a great addition to most neuroscience, psychology or cognitive science classes. Though the methods aren’t too technical (especially by today’s standards), a few approaches, such as population vector and spectral analyses, might be worth unpacking in a class focused on neural data analysis. For everyone else, you can simply explain the why of these methods without digging into the how.
PRE-READING
Rats can’t tell you what they learned in history class, so Igarashi et al. focused on associative learning, a kind of learning in which we make connections—both metaphorical and neural—between different stimuli. One nice feature of the paper is that almost all of the figures share this same basic experimental configuration: The researchers trained animals to associate specific locations and smells while recording from multiple regions of the hippocampus. This setup of using tetrode recordings in freely moving animals should be readily understandable to most undergraduates in psychology or neuroscience.
The analysis of the electrophysiology data is a little tricker. This paper is built on the premise that you can record a noisy voltage trace over time from a brain and use an algorithm known as a Fourier transform to break that trace down into individual sinusoidal frequencies, akin to how a complicated musical recording can be decomposed into pure tones. In other words, the paper views data primarily in the frequency domain rather than in the time domain.
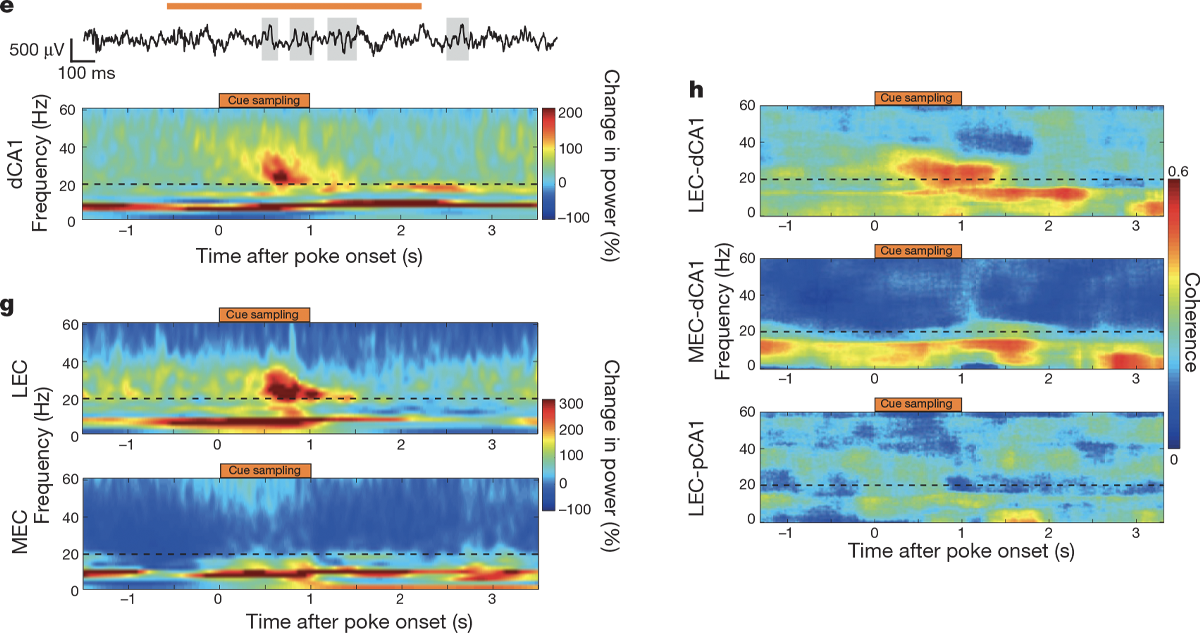
Students don’t need to know the mechanics of a Fourier transform, but they should understand why it is being used and maybe even predict what time series data would look like in the frequency domain. (See “Additional activities” below.) A common way to visualize the decomposition of recordings into frequencies is with a spectrogram, a special kind of heatmap that shows the value of a particular metric (such as the power of a brain wave) for different frequencies (on the y-axis) across time (on the x-axis).
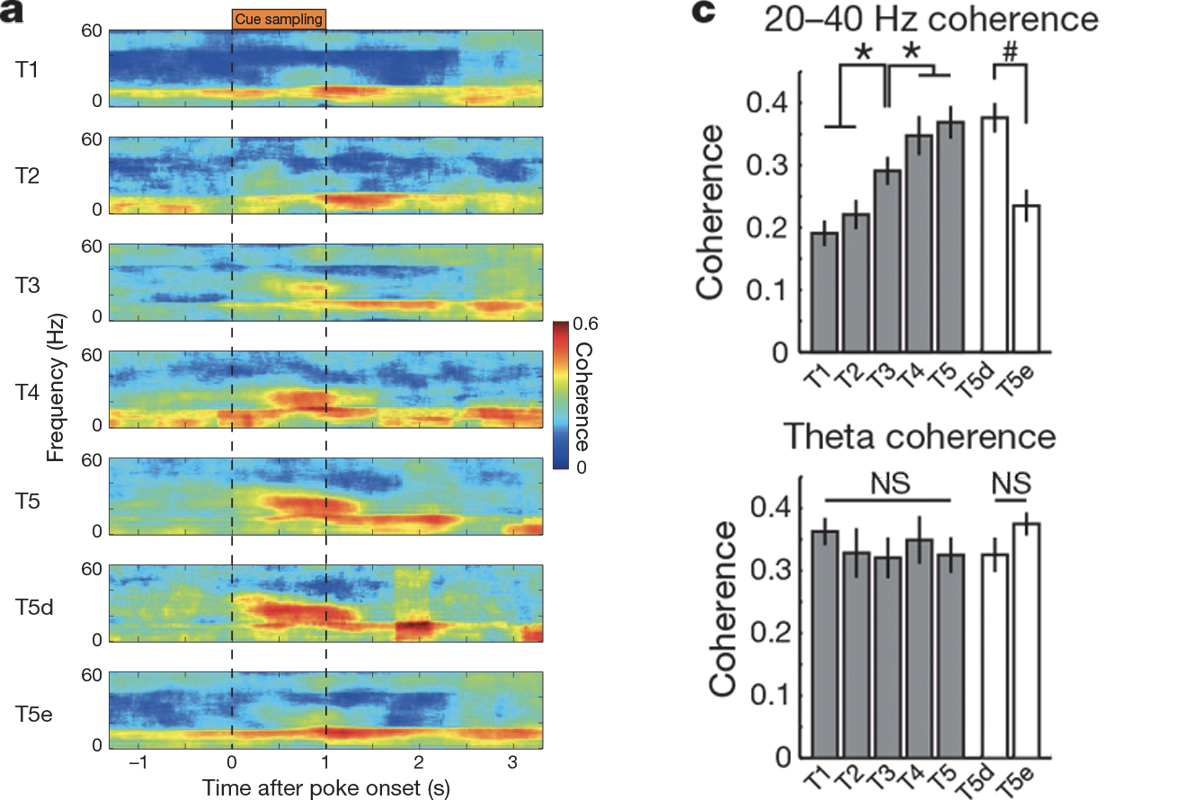
Students should also be familiar with the concept of coherence, or how much the oscillations in two different brain areas are in sync. Imagine two stadiums that are both doing the wave: If those waves hit similar places in the stadium at the same time, we would think of them as being coherent. In the same way, when two brain areas are coherent, their oscillations hit peaks and troughs around the same time. Igarashi et al. use spectrograms to illustrate changes in power and variations in coherence of waves in different frequencies.
WORKING THROUGH THE FIGURES
Let’s start with the behavior itself. In a classic operant conditioning behavior, rats were trained over a few weeks to associate particular odors, such as the smell of roses, with the location of a food cup.
