To develop better nervous-system visualizations, we need to think BIG

With a full mouse connectome on the horizon, neuroscience needs to overcome its legacy of minimalism and embrace the contemporary challenge of representing whole-nervous-system connectivity.

A dense reconstruction of layer 2/3 neurons of the mouse visual cortex containing 394 neurons and 3.2 million synapses.
Neural jungle: This dense reconstruction of layer 2/3 neurons of the mouse visual cortex contains 394 neurons and 3.2 million synapses, all in a volume smaller than a grain of sand. Data from the MICrONS layer 2/3.
Images by Tyler Sloan

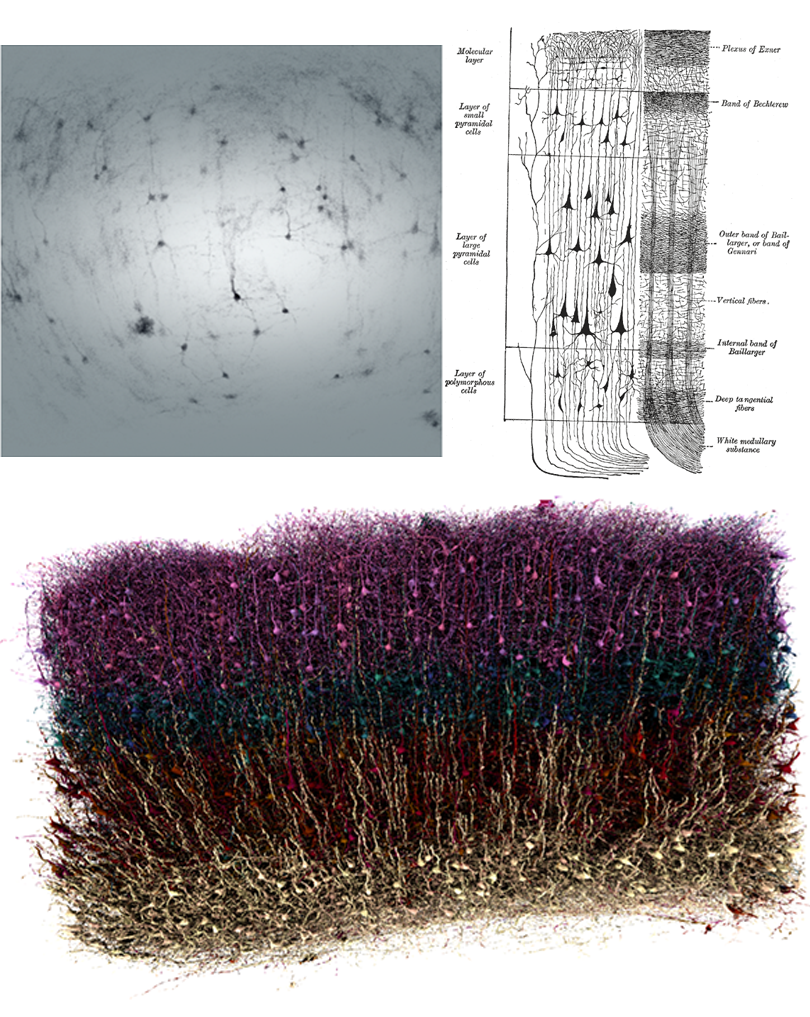
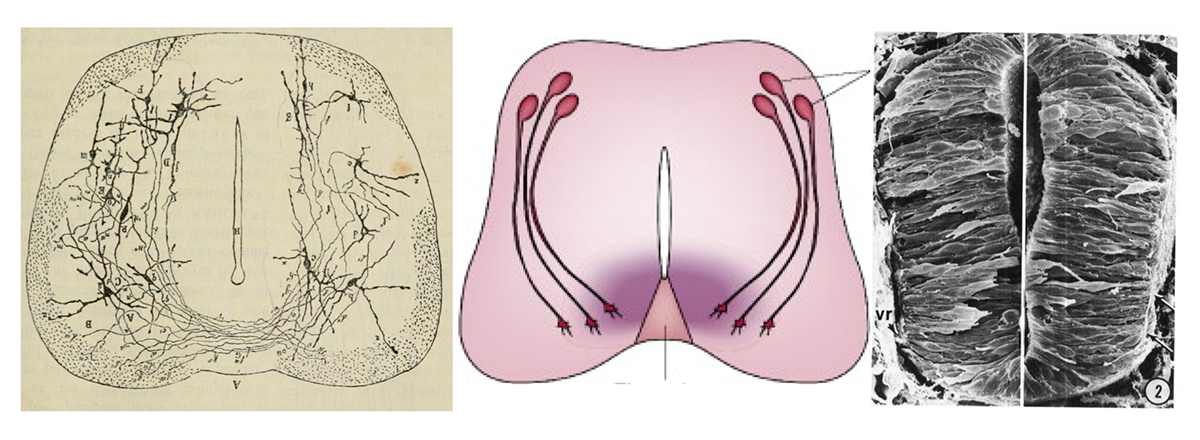
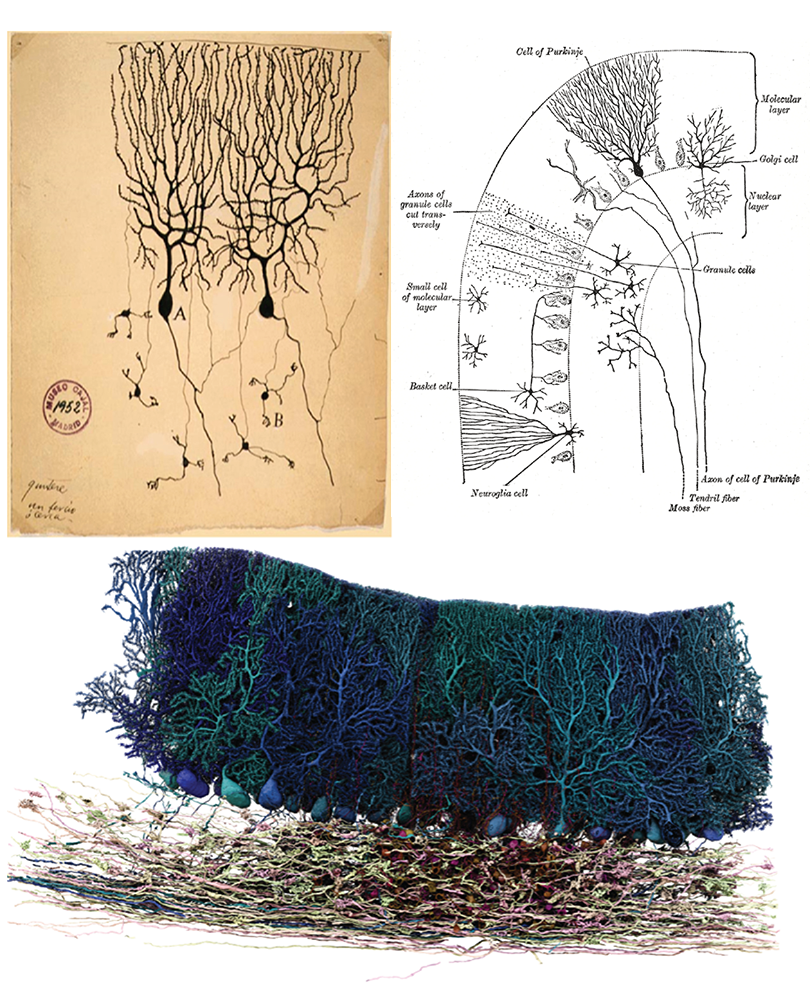
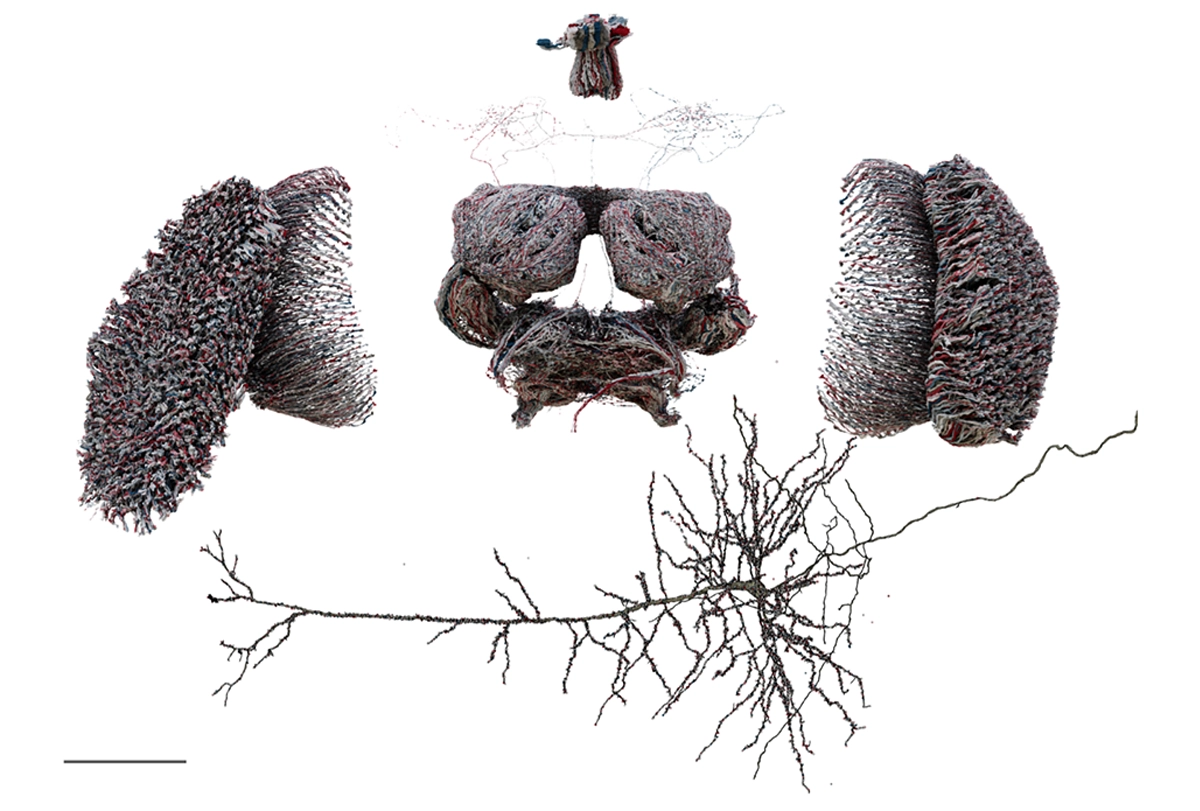
If I ask you to picture a group of “neurons firing,” what comes to mind? For most people, it’s a few isolated neurons flashing in synchrony. This type of minimalist representation of neurons is common within neuroscience, inspired in part by Santiago Ramón y Cajal’s elegant depictions of the nervous system. His work left a deep mark on our intuitions, but the method he used—Golgi staining—highlights just 1 to 5 percent of neurons.

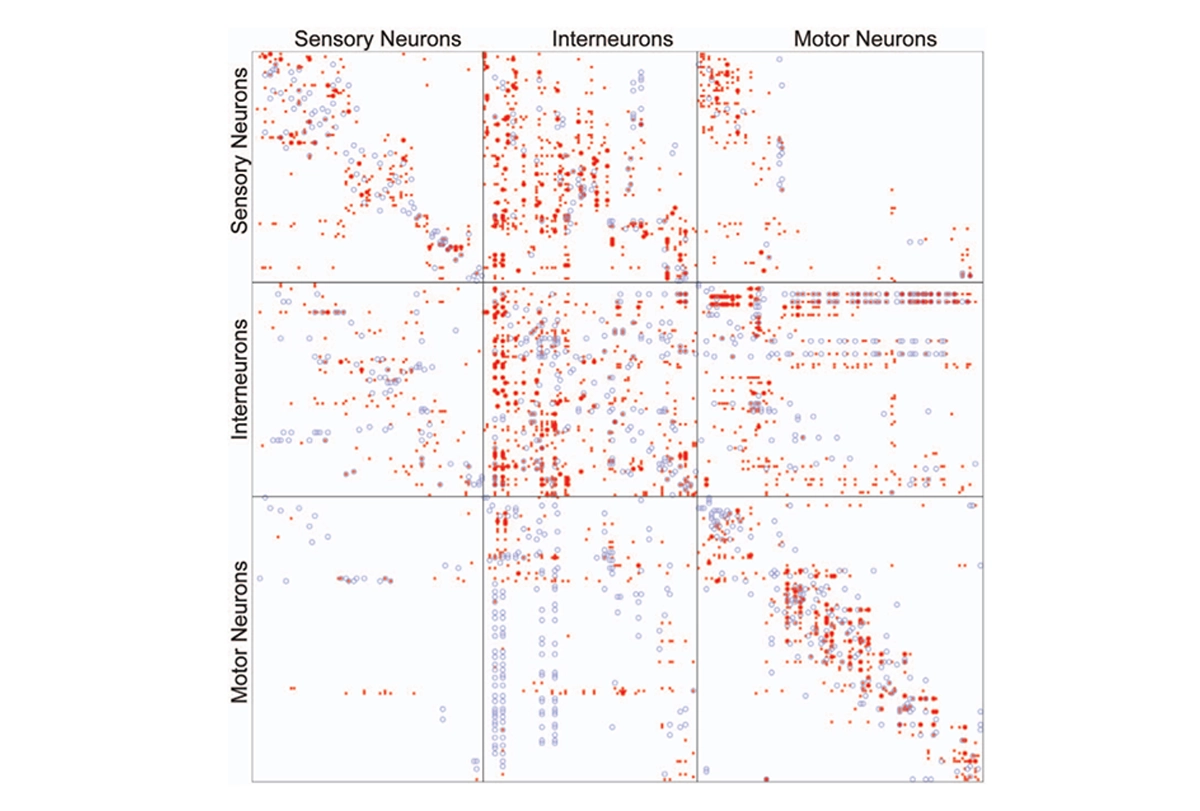
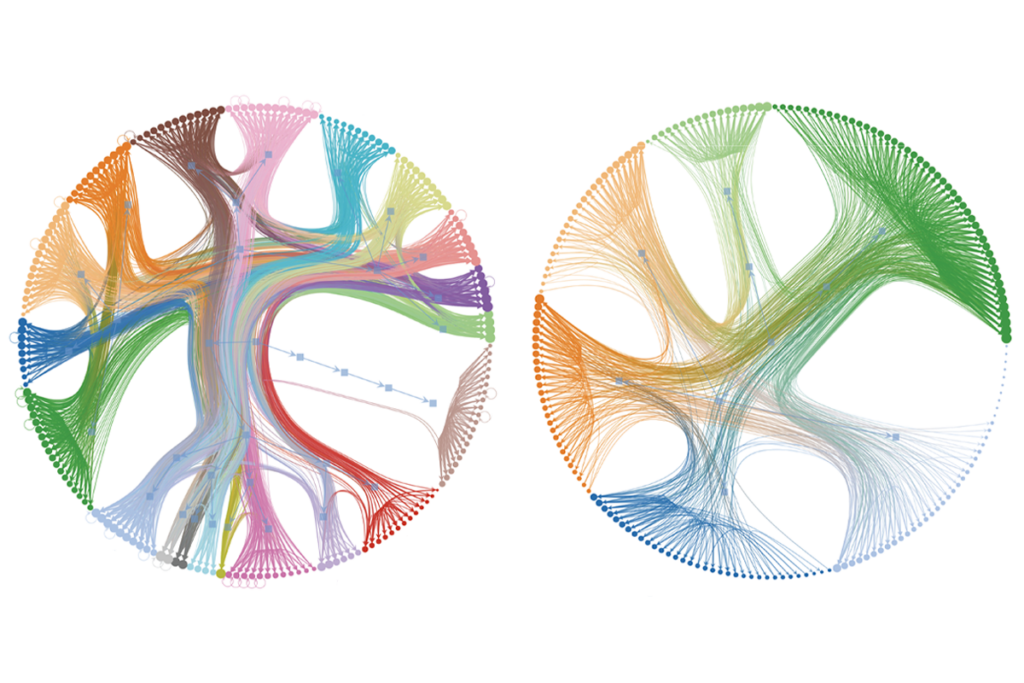
More than a century later, researchers have mapped out brain connectivity in such detail that it easily becomes overwhelming; I vividly recall an undergraduate neurophysiology lecture in which the professor showed a wiring diagram of the primary visual cortex to make the point that it was too complex to understand.


Cortical perspectives: A simulated view of the cortex using classical techniques highlighting just 1 percent of neurons (left). A textbook image of the cortical layers, as shown by different staining techniques, drawn by Henry Vandyke Carter in “Gray’s Anatomy” (1918) (right). Dense 3D reconstruction of neurons in the mouse visual cortex, with different cell layers distinguished by colors: layer 2/3 (purple), layer 4 (blue), layer 5 (red), layer 6 (beige) (bottom). Data from the MICrONS cubic millimeter.


We’ve reached a point where simple wiring diagrams no longer suffice to represent what we’re learning about the brain. Advances in experimental and computational neuroscience techniques have made it possible to map brains in more detail than ever before. The wiring diagram for the whole fly brain, for example, mapped at single-synapse resolution, comprises 2.7 million cell-to-cell connections and roughly 150 million synapses. Building an intuitive understanding of this type of complexity will require new tools for representing neural connectivity in a way that is both meaningful and compact. To do this, we will have to embrace the elaborate and move beyond the single neuron to a more “maximalist” approach to visualizing the nervous system.


Commissural complexity: The simplicity of an early drawing of commissural neurons by Santiago Ramón y Cajal 1890 (left) and a typical schematic of a commissural neuron (middle) sit in stark contrast to a scanning electron micrograph of the developing spinal cord of the chick (right, Holley 1982).


I spent my Ph.D. studying the spinal cord, where commissural growth cones are depicted as pioneers on a railhead extending through uncharted territory. The watershed moment for me was seeing a scanning electron micrograph of the developing spinal cord for the first time and suddenly understanding the growth cone’s dense environment—its path was more like squeezing through a crowded concert than wandering across an empty field. I realized how poor my own intuitions were, which nudged me toward learning the art of 3D visualization.

With this approach, I’ve explored nervous-system connectivity across orders of magnitude, from nanoscopic intracellular synapse distances to tissue-scale cubic millimeters of a mouse brain.  Seeing neurons as they are, in all their glorious complexity, has boosted my own intuitions about how the nervous system is organized, and I hope to share this new appreciation more widely.


Minimalism to maximalism: The elegant structure of Purkinje cells stands out in these drawings by Ramón y Cajal (1899, upper left) and Henry Vandyke Carter in “Gray’s Anatomy” (1918, upper right). 3D reconstructions of Purkinje cells (blue), granule cells (red) and mossy fibers (beige) in the mouse cerebellum highlight the cells’ complex environment (bottom). Models from T.M. Nguyen and L.A. Thomas, et al. in Nature (2022).


N

euroscience got its first full connectome in 1986: a map of the wiring diagram of C. elegans and its 302 neurons and 6,702 synapses. This groundbreaking effort offered a testing ground for how to represent the connectivity of a complete nervous system. Researchers tried various methods, including electrical wiring diagrams, proportional flow charts (boxes linked by arrows with thicknesses proportional to connection strength) and network graphs (in which neurons are the nodes, and their connections are the lines between them). The scale of interaction was difficult to convey—even a relatively simple network graph wiring diagram is visually overwhelming.

A connectivity matrix offers an alternative way to represent wiring information: Each neuron occupies both a row and a column, and the value of an entry in the matrix represents the connection strength between each combination. We can think of this as a nonbinary QR code that contains the connectivity state of a nervous system.


Connectivity QR code: The entire connectome of the C. elegans nervous system is represented in this adjacency matrix, with gap junctions shown in blue, and chemical synapses shown in red. (Varshney et al. 2011)


Though useful for visualizing simple systems, a synapse-resolution connectivity matrix does not scale well to an entire fly brain. If we compress the matrix so that each entry in the matrix occupies one pixel on a display, and the color of each pixel maps the connection strength between each pair of neurons, the entire C. elegans connectome sits comfortably on the screen of a first-generation iPhone. Scaling the representation up to more complex organisms quickly becomes impractical. Even if we increase the pixel density to that of a modern 4K TV, visualizing the full fly brain connectivity matrix at single-neuron resolution would require a display nearly 100 feet wide.

This challenge is not just of scale but also of degree. The entire C. elegans connectome fits inside the Drosophila’s front right leg. A single layer 5 pyramidal neuron in mouse visual cortex receives presynaptic input from a number of cells on the same order of magnitude as the fly’s entire sensory system, almost 17,000 cells. The challenge of how to effectively represent this connectivity is a timely one, as a full mouse brain connectome is likely to be mapped out during the next decade or two.


Scaling challenge: Visualizing even parts of the mouse brain will be much more challenging than visualizing the fly brain. The entire FlyWire Brain sensory superclass contains 16,974 neurons (top) in comparison to a representative layer 5 pyramidal neuron from the mouse visual cortex, which has more than 11,000 incoming synapses. 100-micron scale bar for both images.
Dorkenwald et al., 2023, Schlegel et al., 2023, flywire.ai


Visualizing how every neuron connects with every other at single-cell resolution is clearly infeasible, so researchers need to figure out how to appropriately group neurons when illustrating connectivity. One approach to aggregation has been to summarize neuron-neuron connectivity by region by counting the number of cells that connect each region and reducing the resolution to the level of detail of classical tracing techniques. Another informative tactic has been to group neurons together according to similar location, information flow, form and function by defining cell “classes” or “types” that are consistent between individuals.


Group dynamics: A hemilineage—a group of neurons that originate from the same progenitor cell and follow a similar developmental trajectory—such as these three from the Drosophila brain, offers a potential functional unit for grouping neurons.
Dorkenwald et al., 2023, Schlegel et al., 2023, flywire.ai


A promising approach used in the Drosophila nerve cord is to group the motor neurons into functional “modules” based on the similarity of their premotor input. These modules are conceptually similar to physiological ensembles, albeit defined by anatomical connectivity instead of co-activity. Because highly connected neurons often share functional properties, the growing amount of connectivity data available for other nervous systems should help researchers define functional cell assemblies, offering an effective unit for visually and conceptually grouping neurons.

It’s clear that representing whole-nervous-system connectivity will require some level of aggregation, but the best ways of grouping neurons will likely depend on where you are looking in the nervous system. It may be necessary to represent connectivity at multiple resolutions simultaneously, as in functional parcellation approaches to fMRI analysis.


Like with like: Neurons can be grouped into functional units based on their connectivity. Two motor neurons (turquoise) are grouped into a module based on their shared premotor (light blue) connectivity (left, models from the Drosophila female adult nerve cord, data from Lesser et al. 2024). In the fly brain, cells can be grouped by type, such as this subset of intrinsic optic cells (middle, data from FlyWire, Dorkinwald, et al. 2024). Cortical minicolumns in the mouse visual cortex are thought to be the functional unit of information processing in the cortex. These heavily interconnected columns span all six cortical layers, sharing common inputs and outputs (right, data from the MICrONS cubic millimeter). Individual images are not to scale.


Many questions also remain over how best to move beyond the single neuron as a unit of the connectome. How should researchers delineate its “assemblies”? To what extent will neurophysiologically defined ensembles and connectome-defined ones overlap? New advances in functional connectomics, in which physiological recordings are aligned with synapse-scale connectomic reconstructions, will help address these questions. As we move beyond the one-note approach of the single cell towards thinking of cell assemblies that form the sections of a neural orchestra, I hope that visualizing how these functional modules work together will boost our intuitions and help us see the whole brain anew.

Sign up for our weekly newsletter.

Catch up on what you may have missed from our recent coverage.