Before Carl Linnaeus established his universal system for naming plants, botany was a confusing field. Species were “discovered” multiple times, while papers that used unfamiliar monikers were lost. To complicate matters further, different species featured the same common name—the bluebell, for instance—in different parts of the world.
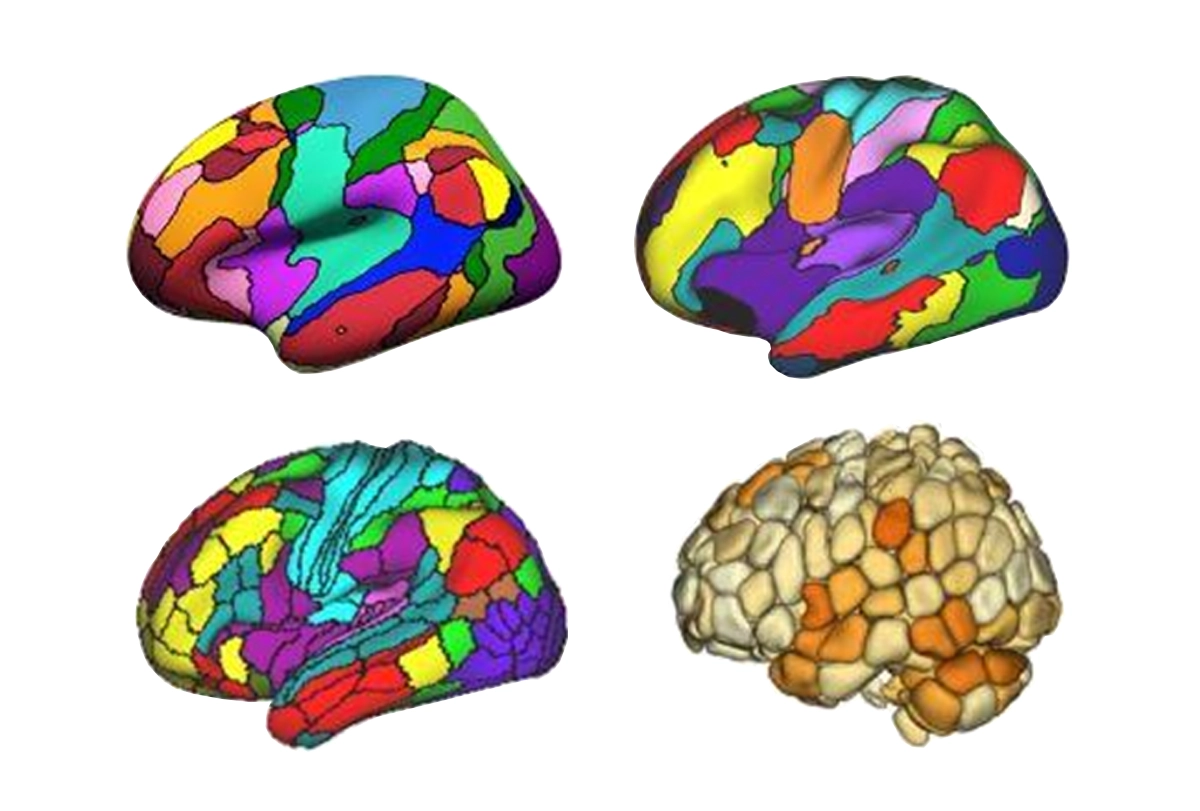
Nowadays the same problem plagues neuroimaging research, which has evolved from focusing on individual regions to interacting networks. But those networks sometimes go by alternate names across different labs. And researchers may use the same term—such as “salience network”—to refer to different groups of interacting brain regions.
That ambiguity has had a detrimental effect on the field’s progress, says Bradley Voytek, professor of cognitive science at the University of California, San Diego. “It would be a big problem in world geopolitics if the United States defined NATO one way, and the United Kingdom defined it another way,” he says, by way of analogy.
In the absence of a universal mapping and naming system for brain networks—at least so far—a new open-source tool aims to help researchers to compare images of brain activity across several, variously annotated brain-parcellation atlases.
“We realize that not everyone is going to agree on what to call something, but perhaps we could make it easier to translate findings across groups,” says the tool’s co-lead investigator Lucina Uddin, professor of psychiatry and biobehavioral sciences at the University of California, Los Angeles. “Essentially, this tool is almost like a decoder.”
T
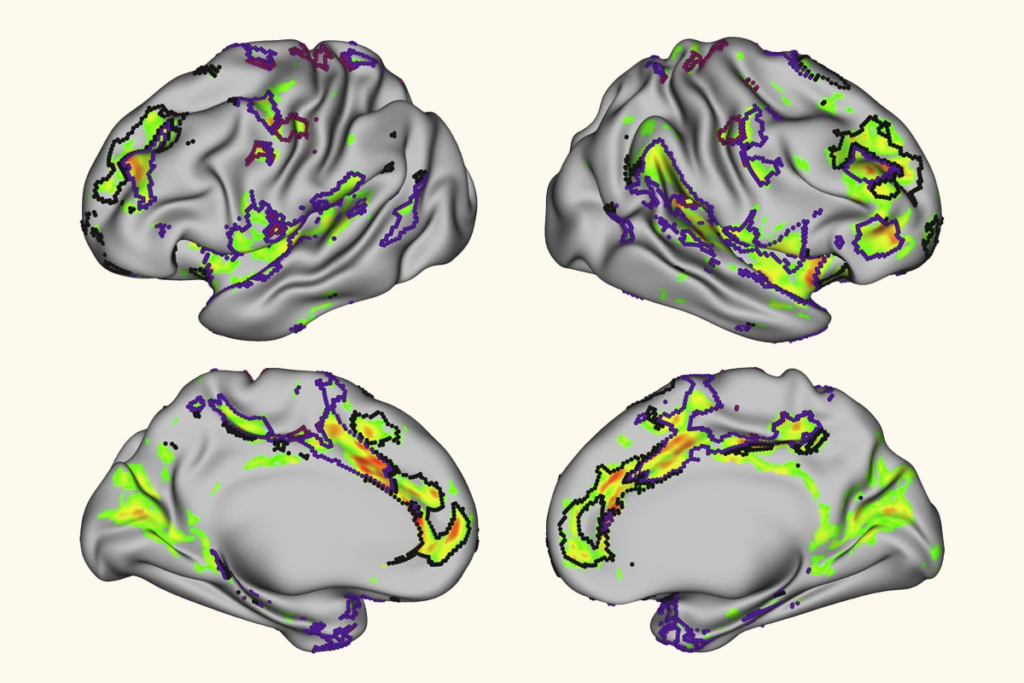
he tool—called the Network Correspondence Toolbox (NCT)—matches a user’s uploaded fMRI data to networks and their aliases in 16 commonly used atlases. On those hits, the software performs a statistical analysis and presents the results as a heatmap: Brighter patches indicate high levels of similarity between the new data and a given brain network.For instance, data in an fMRI scan from the UK Biobank corresponded to the visual network in all eight atlases tested, according to a preprint describing the NCT that Uddin and her colleagues posted in June on bioRxiv. But another scan matched less consistently, showing overlap with multiple networks across the various atlases.
The output could help researchers to better name these circuits when presenting their findings, the authors write in their preprint. And in the long run, the tool could improve reproducibility and make it easier to compare studies, they add.
But low correspondence to published networks doesn’t necessarily mean there’s an issue with the data. Instead, it could hint at novel findings and might lead to the development of new theories, says co-lead investigator Thomas Yeo, associate professor of electrical and computer engineering at the National University of Singapore. “Low correspondence with existing atlases could tell us something new about the brain.”
T
he tool may be especially valuable to novice researchers, who are less familiar with the nuanced world of network-naming, says Scott Marek, assistant professor of radiology at Washington University, who was not involved in the work. “My hope is that this tool will enable us to start using a common nomenclature when referring to specific brain networks.”And it’s the younger generation of researchers who have the most tech savvy to readily download and apply the tool, which is written using the Python programming language, says Voytek, who didn’t take part in the research. “I think it will eventually become more of a norm for the field to use these kinds of tools. But how long that takes, I don’t know.”
The NCT’s creators are working to ensure the tool is manageable for everyone, Uddin says. They have provided an instruction manual for installing and running Python and are currently tweaking the tool based on user feedback.
“We’re working out the kinks and hopefully by the time the paper comes out it will be smooth sailing,” she says.
The team plan to enhance NCT’s functionality by adding more atlases, which users are also able to upload, Uddin says. But the tool can be used to analyze other types of data, too, such as gene expression maps. “It’s really a tool for quantifying overlap,” she says.
