Accounting for autism’s prevalence
Recent articles

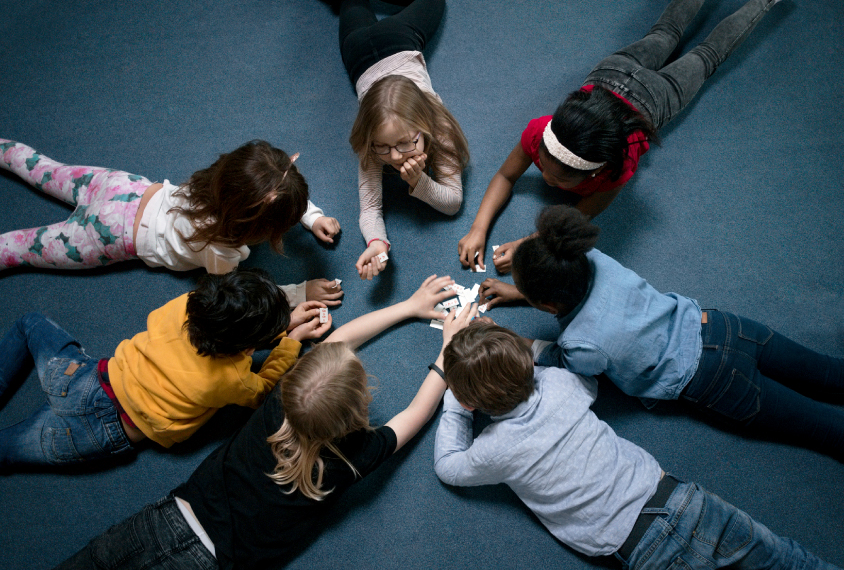
U.S. study charts changing prevalence of profound and non-profound autism
Profound autism prevalence rose from 2002 to 2016, though not nearly as much as non-profound autism did.
U.S. study charts changing prevalence of profound and non-profound autism
Profound autism prevalence rose from 2002 to 2016, though not nearly as much as non-profound autism did.
U.S. autism prevalence continues to rise as race and sex gaps shrink, new stats show
About 1 in 36 children in the United States has autism, up almost 20 percent from the previous estimate, reflecting improved identification, particularly among girls and Black, Hispanic and Asian or Pacific Islander children.
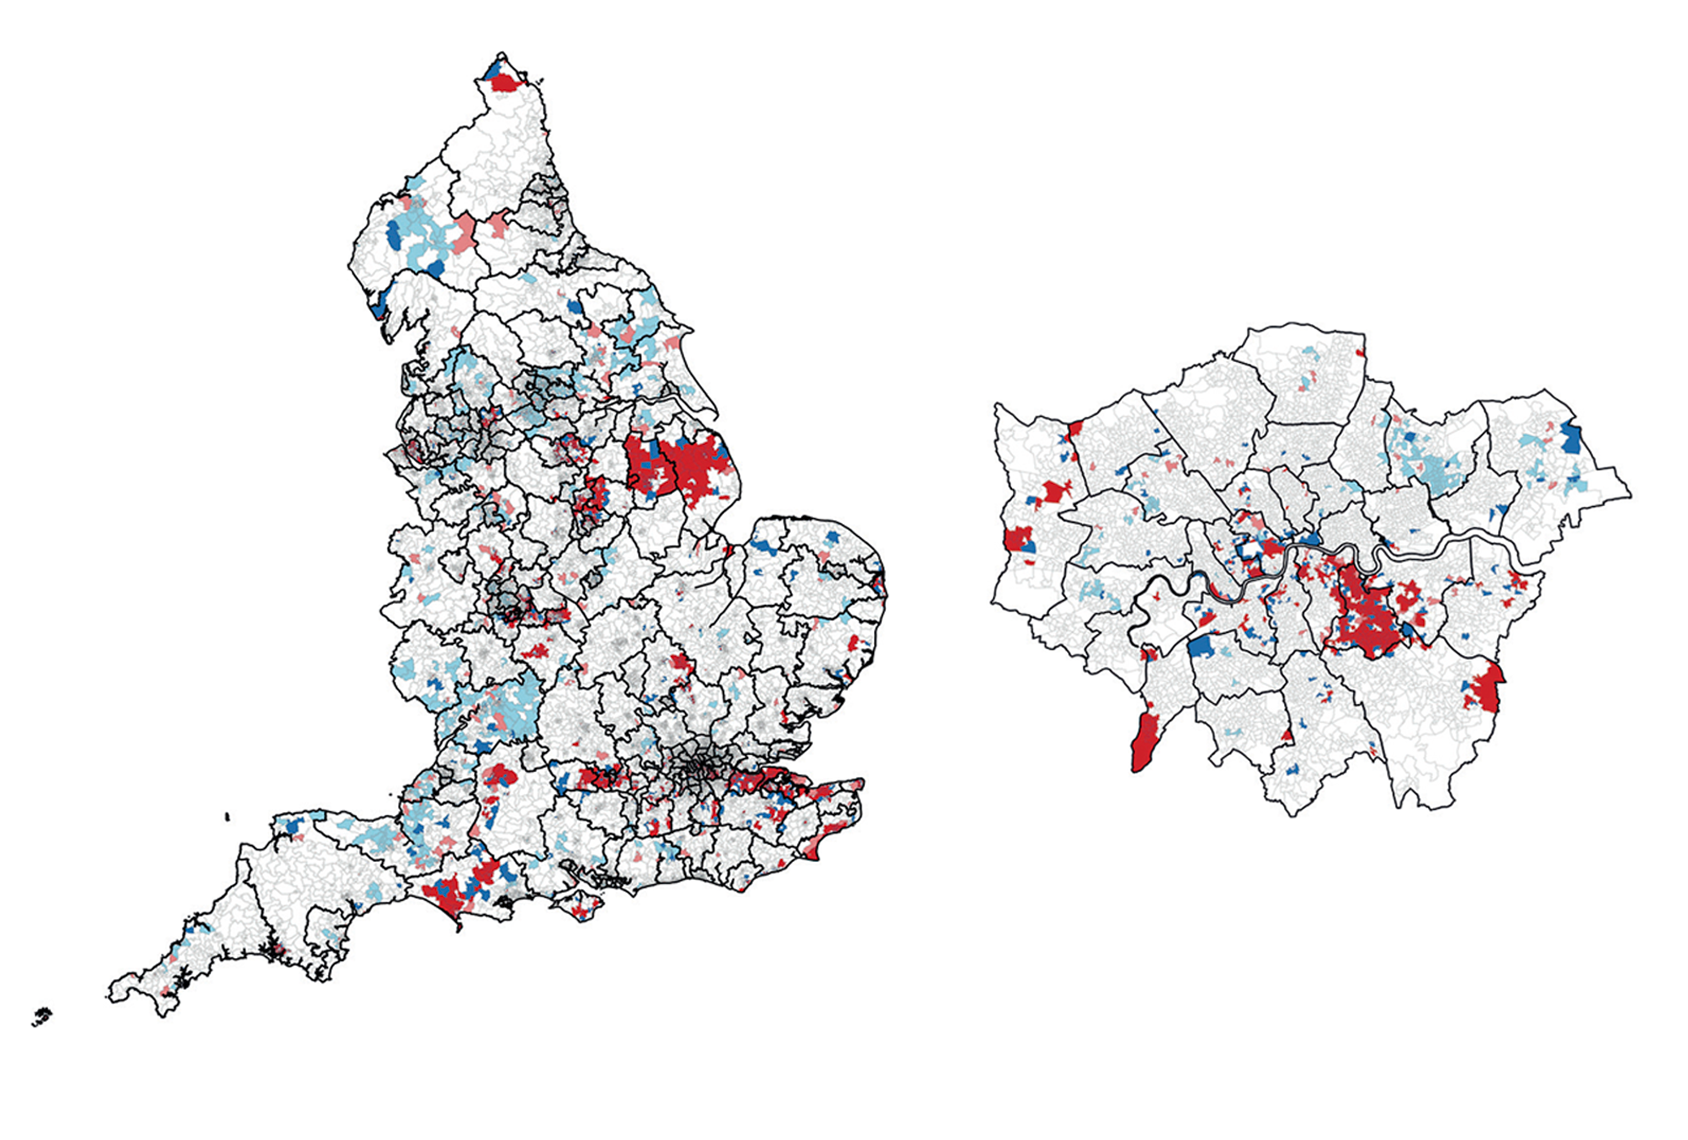
Autism incidence in England varies by ethnicity, class, location
High rates of autism are linked to lower socioeconomic status and minority ethnic groups, according to the largest-ever autism incidence study.
Autism incidence in England varies by ethnicity, class, location
High rates of autism are linked to lower socioeconomic status and minority ethnic groups, according to the largest-ever autism incidence study.

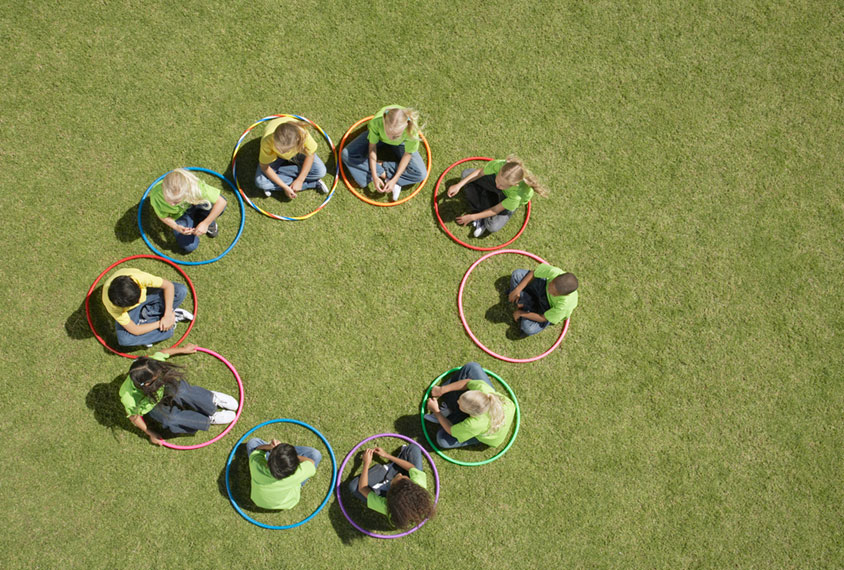
Autism by the numbers: Explaining its apparent rise
Is autism really more common among children today than in generations past? This new downloadable book offers an in-depth guide to the various factors that have helped to drive autism prevalence numbers up.
Autism by the numbers: Explaining its apparent rise
Is autism really more common among children today than in generations past? This new downloadable book offers an in-depth guide to the various factors that have helped to drive autism prevalence numbers up.
U.S. autism prevalence inches upward as racial gaps close
Autism prevalence in the United States rose to 1 in 44 children in 2018, up from 1 in 54 in 2016.
U.S. autism prevalence inches upward as racial gaps close
Autism prevalence in the United States rose to 1 in 44 children in 2018, up from 1 in 54 in 2016.
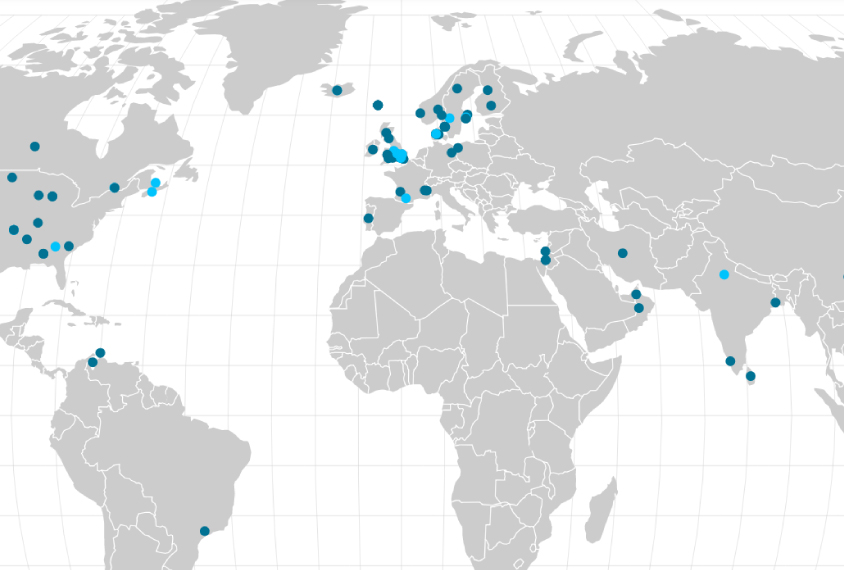
Map of global autism prevalence
View an interactive map of studies on autism prevalence around the world. The map highlights places where information is available — and places where information is missing.
Map of global autism prevalence
View an interactive map of studies on autism prevalence around the world. The map highlights places where information is available — and places where information is missing.
Explore more from The Transmitter
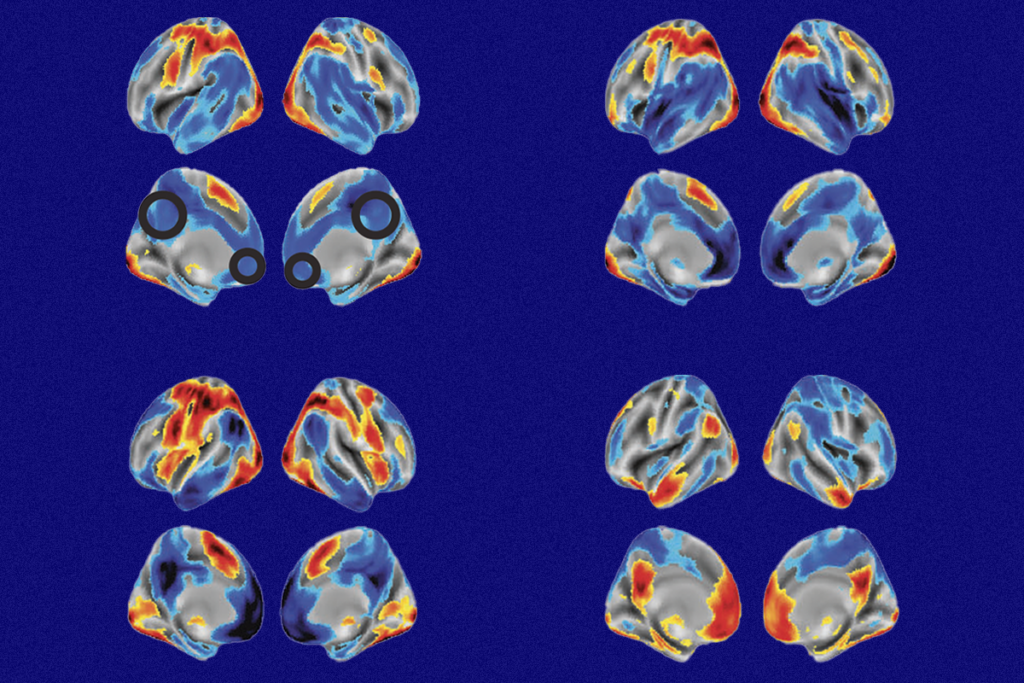
During decision-making, brain shows multiple distinct subtypes of activity
Person-to-person variability in brain activity might represent meaningful differences in cognitive processes, rather than random noise.
During decision-making, brain shows multiple distinct subtypes of activity
Person-to-person variability in brain activity might represent meaningful differences in cognitive processes, rather than random noise.
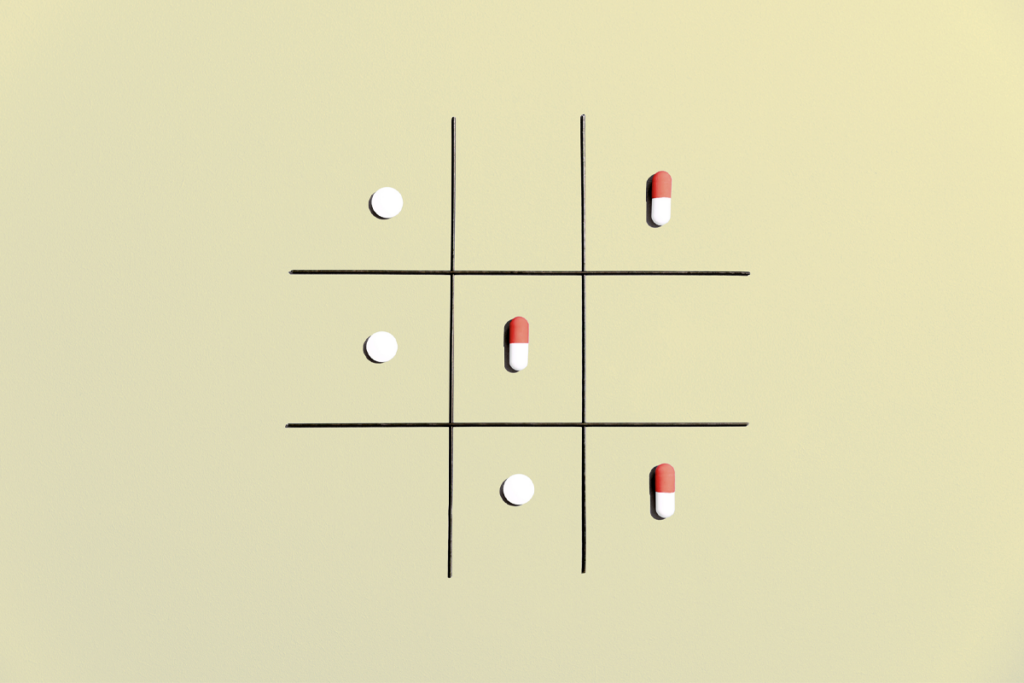
Basic pain research ‘is not working’: Q&A with Steven Prescott and Stéphanie Ratté
Prescott and Ratté critique the clinical relevance of preclinical studies in the field and highlight areas for improvement.
Basic pain research ‘is not working’: Q&A with Steven Prescott and Stéphanie Ratté
Prescott and Ratté critique the clinical relevance of preclinical studies in the field and highlight areas for improvement.
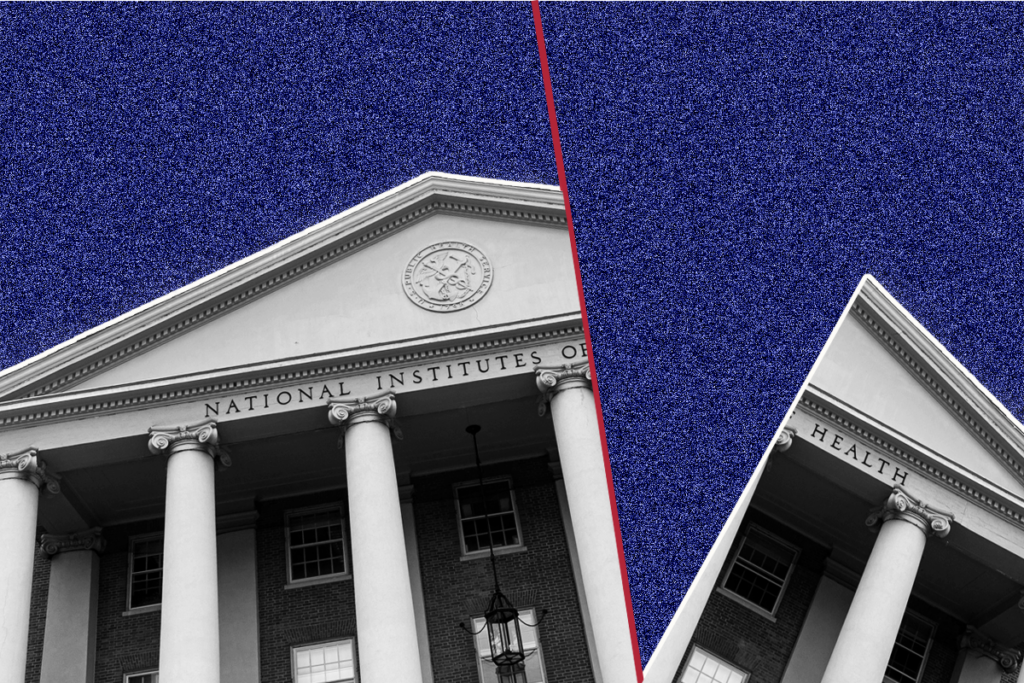
Proposed NIH budget cut threatens ‘massive destruction of American science’
A leaked draft of a Trump administration proposal includes an approximately 40 percent cut to the National Institutes of Health’s budget and a major reorganization of its 27 institutes and centers.
Proposed NIH budget cut threatens ‘massive destruction of American science’
A leaked draft of a Trump administration proposal includes an approximately 40 percent cut to the National Institutes of Health’s budget and a major reorganization of its 27 institutes and centers.